Product updates
Let’s talk data: a fresh look at SoPost’s reporting dashboards.
Monday, February 3, 2025
It's been a hot minute since we talked about our reporting dashboards at SoPost. We're always busy adding powerful new reporting features to help you get the most from your sampling campaigns.
From monitoring overall performance to drilling down into audience feedback and tracking sample stock (hello, brand new stock page and notifications), these reporting dashboards give you everything you need to monitor and run smarter sampling campaigns.
So, here's a refresher on everything you'll access in our live, real-time reporting dashboards – and how this data can help you better manage and optimize your strategies.
Contents:
Overview page: get the big picture
Orders page: monitor campaign progress in real time
NEW! Stock page and notifications: keep your campaign stock on track
Feedback page: instantly spot trends in consumer feedback
Email page: monitor email performance
Demographics page: view key audience insights
Explore our interactive demo ▶️
The SoPost difference: data plus expertise
Overview page: get the big picture
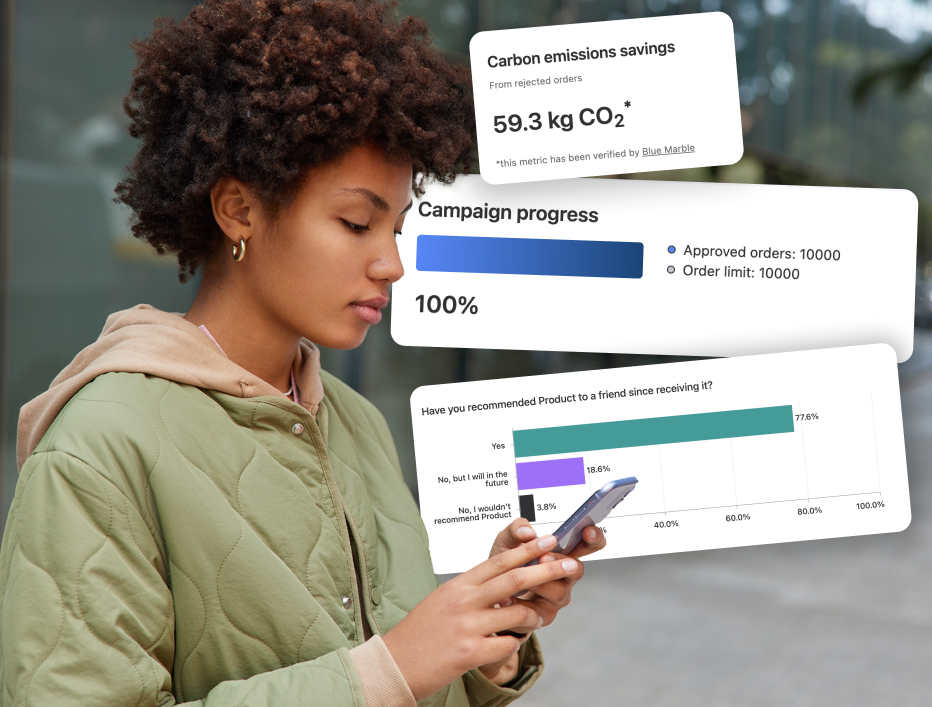
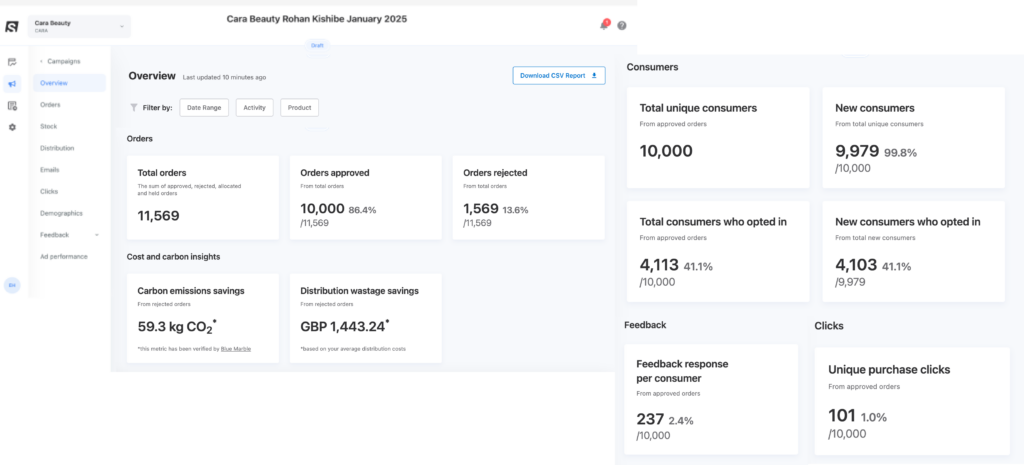
Our Overview page gives you a high-level snapshot of your campaign's key metrics. With our customizable filters, you can also quickly zoom in on the data that matters to you most, helping you make proactive decisions while your campaign is still live. You’ll see:
Total orders: see approved and rejected orders in real time
Sustainability savings: monitor carbon emissions and distribution waste savings
Consumer insights: identify total unique consumers, new consumers, and marketing opt-ins
Engagement data: track purchase clicks and feedback responses
Ran multiple campaigns with us? You’ll also get access to our Brand Overview page that consolidates insights across all your campaigns, making it easy to spot trends, track KPIs and strategize for the future.
📊 How can you use reporting dashboard data?
Spot opportunities for improvement and make tweaks mid-campaign for optimal results. For example, are you falling short on your marketing opt-in target? Revisit the wording on sample request forms to ensure it’s as enticing as possible.
And why not showcase your sustainability savings in future reports or marketing campaigns? It’s a great way to highlight eco-friendly efforts that resonate with today's consumers.
Orders page: monitor campaign progress in real time
Our Orders page breaks down every detail, and our intuitive filters make it easy to find the data you need – fast. You can track:
Approved vs. rejected orders: monitor daily claims and view trends over time
Campaign progress: monitor claim rate against sample orders in real time
Rejection reasons: understand why orders were declined (e.g. duplicate submissions, invalid addresses)
SoPost’s Intelligent Order Processing insights: see how many consumers we filtered using our intelligent AI technology
Activity breakdown: monitor orders for all your activation types and track conversion rate per lead ad activity – especially helpful when you’re running multiple ad campaigns across platforms

📊 How can you use this data?
Is your daily claim rate starting to slow down? Revisit and tweak your audience targeting or ad creative to entice more conversions! Noticed a particular lead ad or platform performing way better than another? Consider reallocating your media budgets to maximize results.
NEW! Stock page and notifications: keep your campaign stock on track
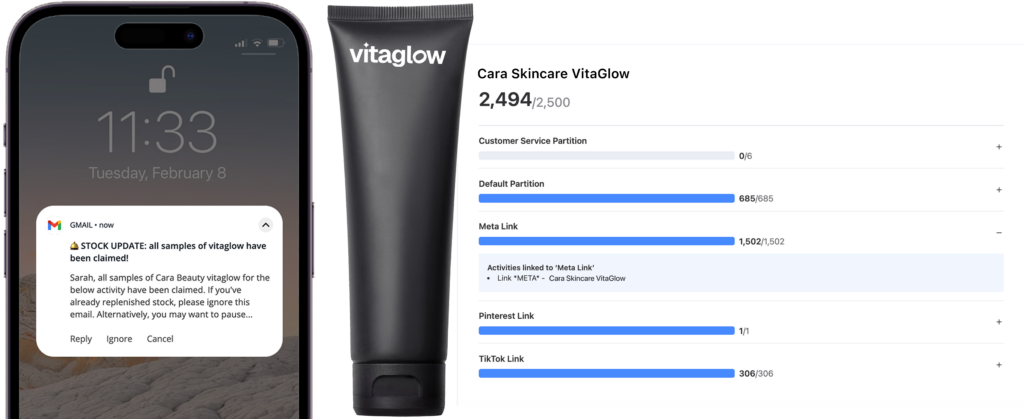
Our brand new Stock page shows live updates on remaining samples so you can keep tabs on stock levels, broken down by SKU and sample allocation to easily spot which product(s) and platforms are most popular.
And now, with real-time stock notifications, you'll get instant email alerts when your campaign stock has run out. Track specific campaigns based on your priorities and access detailed stock insights – right from your inbox.
📊 How can you use this data?
Notice your stock levels going down quicker than anticipated or received an email to say you've run out? Add lead capping until stock levels stabilize or strategically pause your media spend. That way, you avoid the dreaded “out of stock” scenario and keep your media budgets under control.
Post-campaign, review usage and demand patterns to help forecast future sample allocation needs.
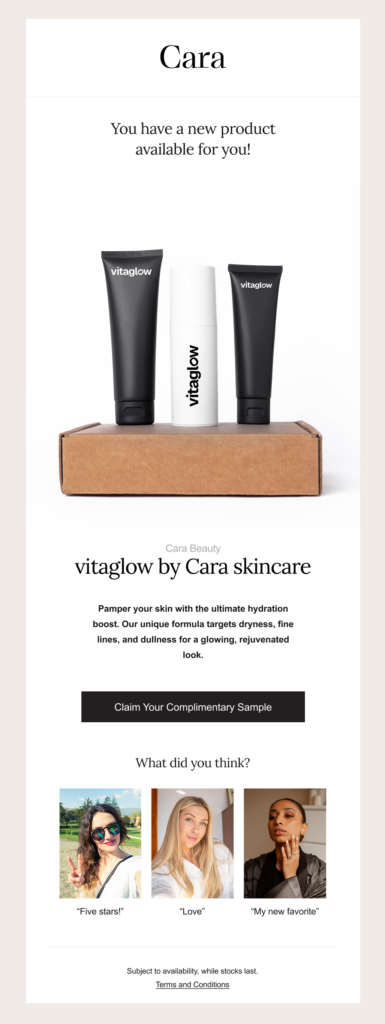
Feedback page: instantly spot trends in consumer feedback
Our Feedback page is your hub for review data and responses, including:
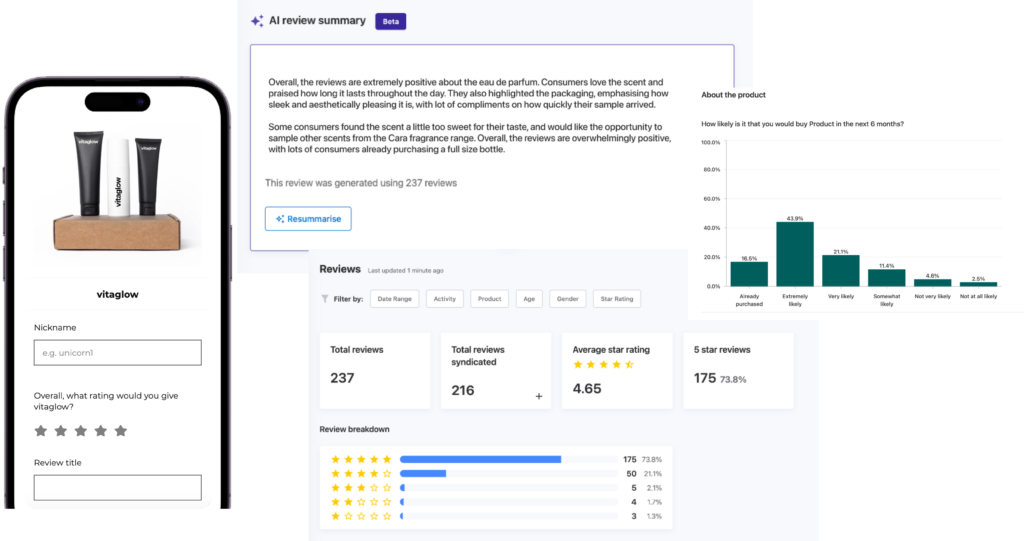
Total reviews and star ratings: see overall feedback performance at a glance
Recommendation and purchase intent: see how many consumers have recommended and are likely to buy or have already purchased your product
Custom question responses: gather tailored insights from your audience
AI Review Summaries: instantly identify key feedback themes and product sentiment with the power of AI
User-generated content: access a gallery of all UGC collected during your campaigns alongside reviews.
📊 How can you use this data?
People trust people more than ads – use these new reviews for product launches to build trust and influence purchases. Plus, you can gauge overall product interest and post-trial purchases by monitoring purchase intent question responses.
Seeing consumers rave about a particular feature of your product? Amplify this messaging in your next campaign and future marketing efforts. Noticing consistent feedback on improvements needed? Make proactive changes while the campaign is live to better meet consumer expectations.
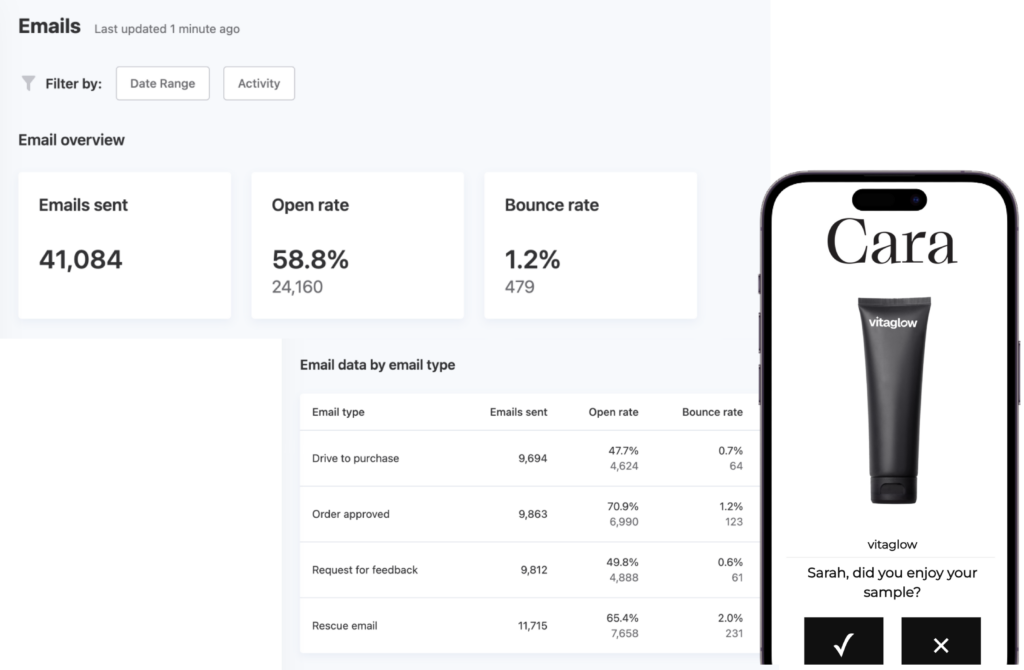
Email page: monitor email performance
From open rates to bounce rates, our Email page tracks key metrics by email type including drive to purchase and feedback requests, so you can see what’s driving the most engagement and where there may be room for improvement.
📊 How can you use this data?
Did your purchase emails get lots of engagement but you’d like to see even more feedback responses next time? Consider collecting UGC as part of your reviews and including them in emails to peak more interest and drive better engagement.
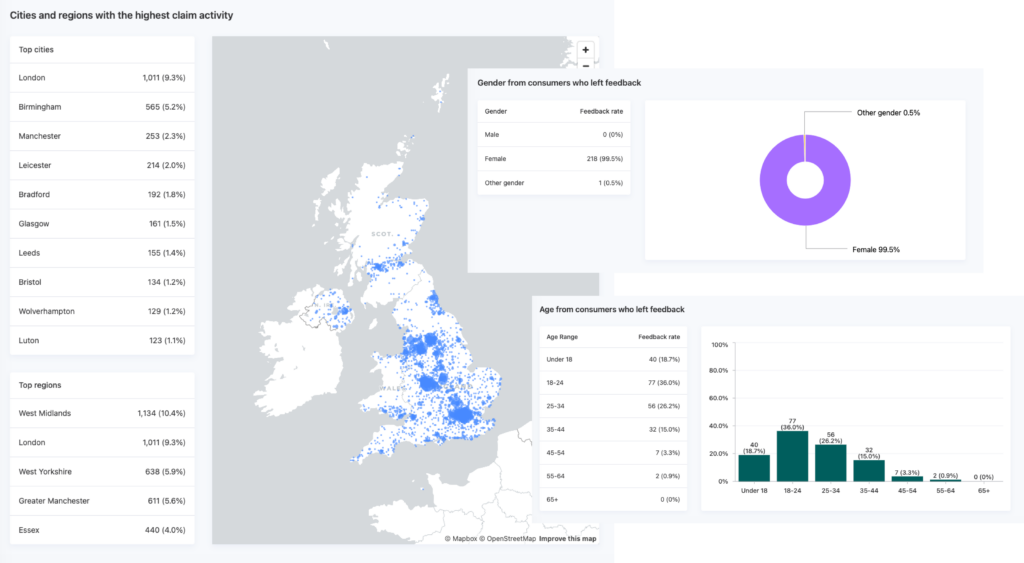
Demographics page: view key audience insights
Want to know more about your audience? Our Demographics page answers key questions, such as:
Where are your consumers located?
What is their age and gender?
Which cities and regions are your top performers for sample claims?
📊 How can you use this data?
Double down on high-performing regions by increasing your media spend in those areas. Identifying strong sample claims from a previously overlooked market? Tailor future campaigns to tap into that audience segment more effectively.
Explore our interactive demo
Want a full walkthrough of our campaign dashboards? Check out our interactive demo:
The SoPost difference: data plus expertise
While our reporting dashboards offer powerful insights so you can manage and optimize your live campaigns, the real magic happens with the additional guidance of SoPost's sampling experts. Your dedicated Customer Success Manager will also monitor your campaign and walk you through detailed post-campaign analysis, offering actionable insights and strategies to optimize your sampling efforts.
With over 12 years of experience, our team builds true partnerships with your brand, working with you to continuously refine and improve your sampling campaigns for long-term success.
Want to know more about the true ROI of product sampling? Learn about the often-overlooked ripple effect here.